What is this post about?
The change of variable for probability density functions (pdfs) is a simple yet powerful tool. It is the foundation for some of my research, which is why I feel comfortable writing this tutorial, but it is also the main component of other ML techniques such as normalizing flows.
In this post, I want to introduce the concept and then explore increasingly complex examples. Since I think in a very visual fashion, I try to illustrate all major concepts through GIFs or figures. If you want to play around with the figures you can find them at this GitHub repo.
If you have constructive feedback don’t hesitate to write me. If you like it, share it with others.
Change of variable for pdfs
If we apply a transformation \(g(x): \mathbb{R} \rightarrow \mathbb{R}\) to a random variable \(X\) then its pdf \(p_X(x)\) changes. If \(g(x)\) is a monotonic function then the pdf \(p_Y(y)\) of the transformed random variable \(Y\) can be computed with
\[\begin{aligned} p_Y(y) &= p_X(g^{-1}(y)) \left\vert \frac{d}{dy}(g^{-1}(y)) \right\vert \end{aligned}\]where \(g^{-1}\) describes the inverse function of \(g\).
The first part of the equation, \(f_X(g^{-1}(y))\), simply means that all occurrences of \(x\) in the original pdf \(p_X(x)\) are replaced with the inverse function of your desired transformation \(g^{-1}(y)\). I like to imagine \(p_X(x)\) as a wire. The transformation is then simply a shift, stretch, or compression of this wire. As we will see later, a transformation can stretch the wire at one part and compress it at another.
The second part, \(\left\vert \frac{d}{dy}(g^{-1}(y)) \right\vert\), makes sure that the new pdf \(p_Y(y)\) is a valid pdf, i.e. it still integrates to 1. The change of variable might increase or decrease the area under the function which would imply that the result is not a valid pdf. The determinant of the Jacobian can be seen as the inverse of the volume of the transformation. Thus this second part can be interpreted as a normalizing factor.
In the following, we will investigate only a selection of features. For more properties or high-dimensional transformations I recommend the Wikipedia article.
Adding a constant: y = x+c
Adding a constant to a random variable, i.e. \(y = x + c\), can be interpreted as a shift of the distribution. With the change of variable equation we get
\[\begin{aligned} g^{-1}(y) &= y-c \\ p_Y(y) &= f_X(g^{-1}(y)) \cdot 1 \end{aligned}\]where \(\left\vert \frac{d}{dy}(g^{-1}(y)) \right\vert = 1\) because the transformation doesn’t change the volume of the pdf.
In the specific case of the Gaussian distribution with \(c=1\) we get
\[p_Y(y) = \frac{1}{\sqrt{2 \pi \sigma^2}} \exp \left(-\frac{(x-1-\mu)^2}{2\sigma^2} \right)\]Visually, this is
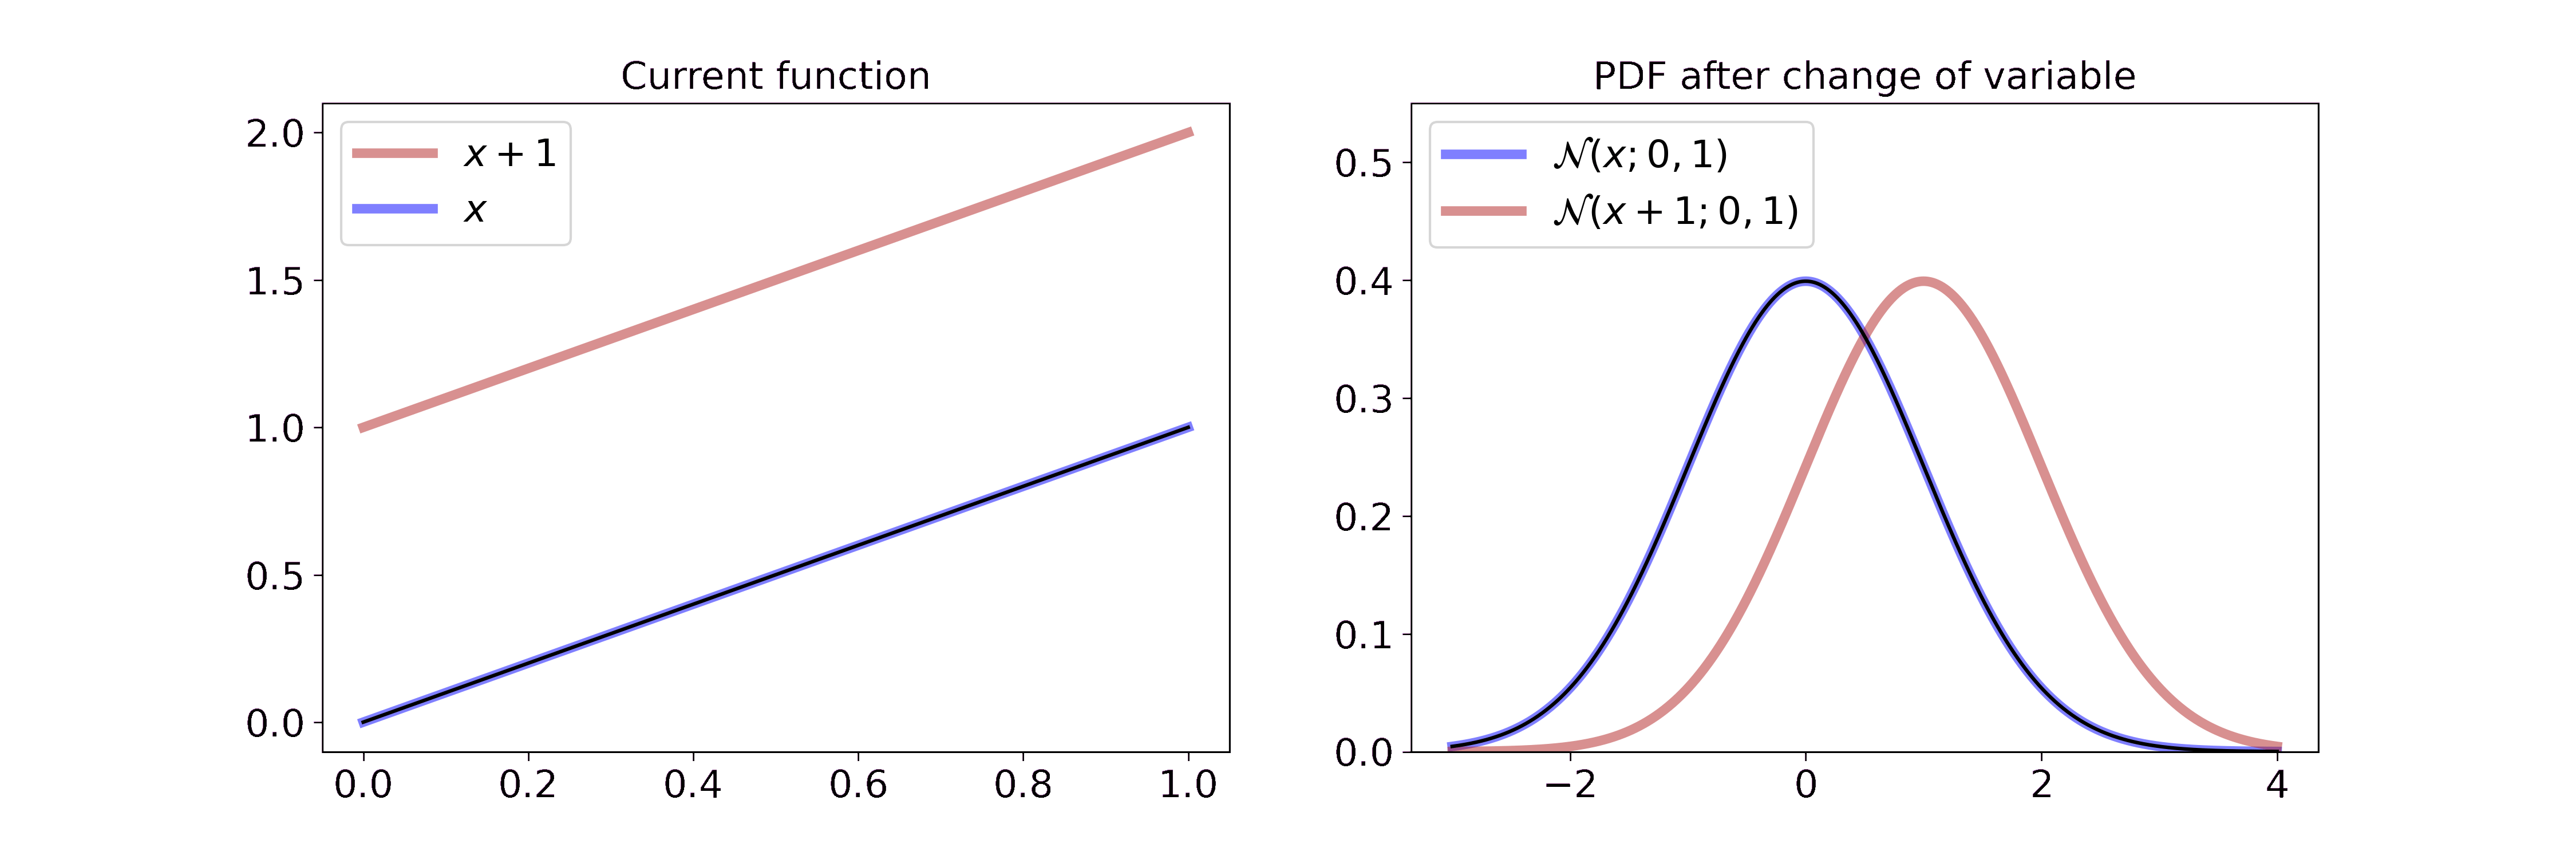
On the left we interpolate between the function \(x\) and \(x+1\). On the right we interpolate between the resulting Gaussian pdf after a change of variable with the transformation from the left. Since adding a constant doesn’t change the volume, the transformation merely shifts the Gaussian to the right. If you want to step through the GIF at your own pace you can find an HTML document in the GitHub repo or tell me how to embed .html files in Markdown.
Multiplying with a constant: y = c*x
Multiplying a random variable with a constant, i.e. \(y=c*x\), can be interpreted as compressing or stretching the pdf. We have
\[\begin{aligned} g^{-1}(y) &= c * y \\ p_Y(y) &= f_X(g^{-1}(y)) \cdot 1/c \end{aligned}\]where \(\left\vert \frac{d}{dy}(g^{-1}(y)) \right\vert = 1/c\).
For a Gaussian random variable with \(c=2\) we get
\[p_Y(y) = \frac{1}{\sqrt{2 \pi \sigma^2}} \exp \left(-\frac{(x/2-\mu)^2}{2\sigma^2} \right) \cdot \frac{1}{2}\]Visually, this is
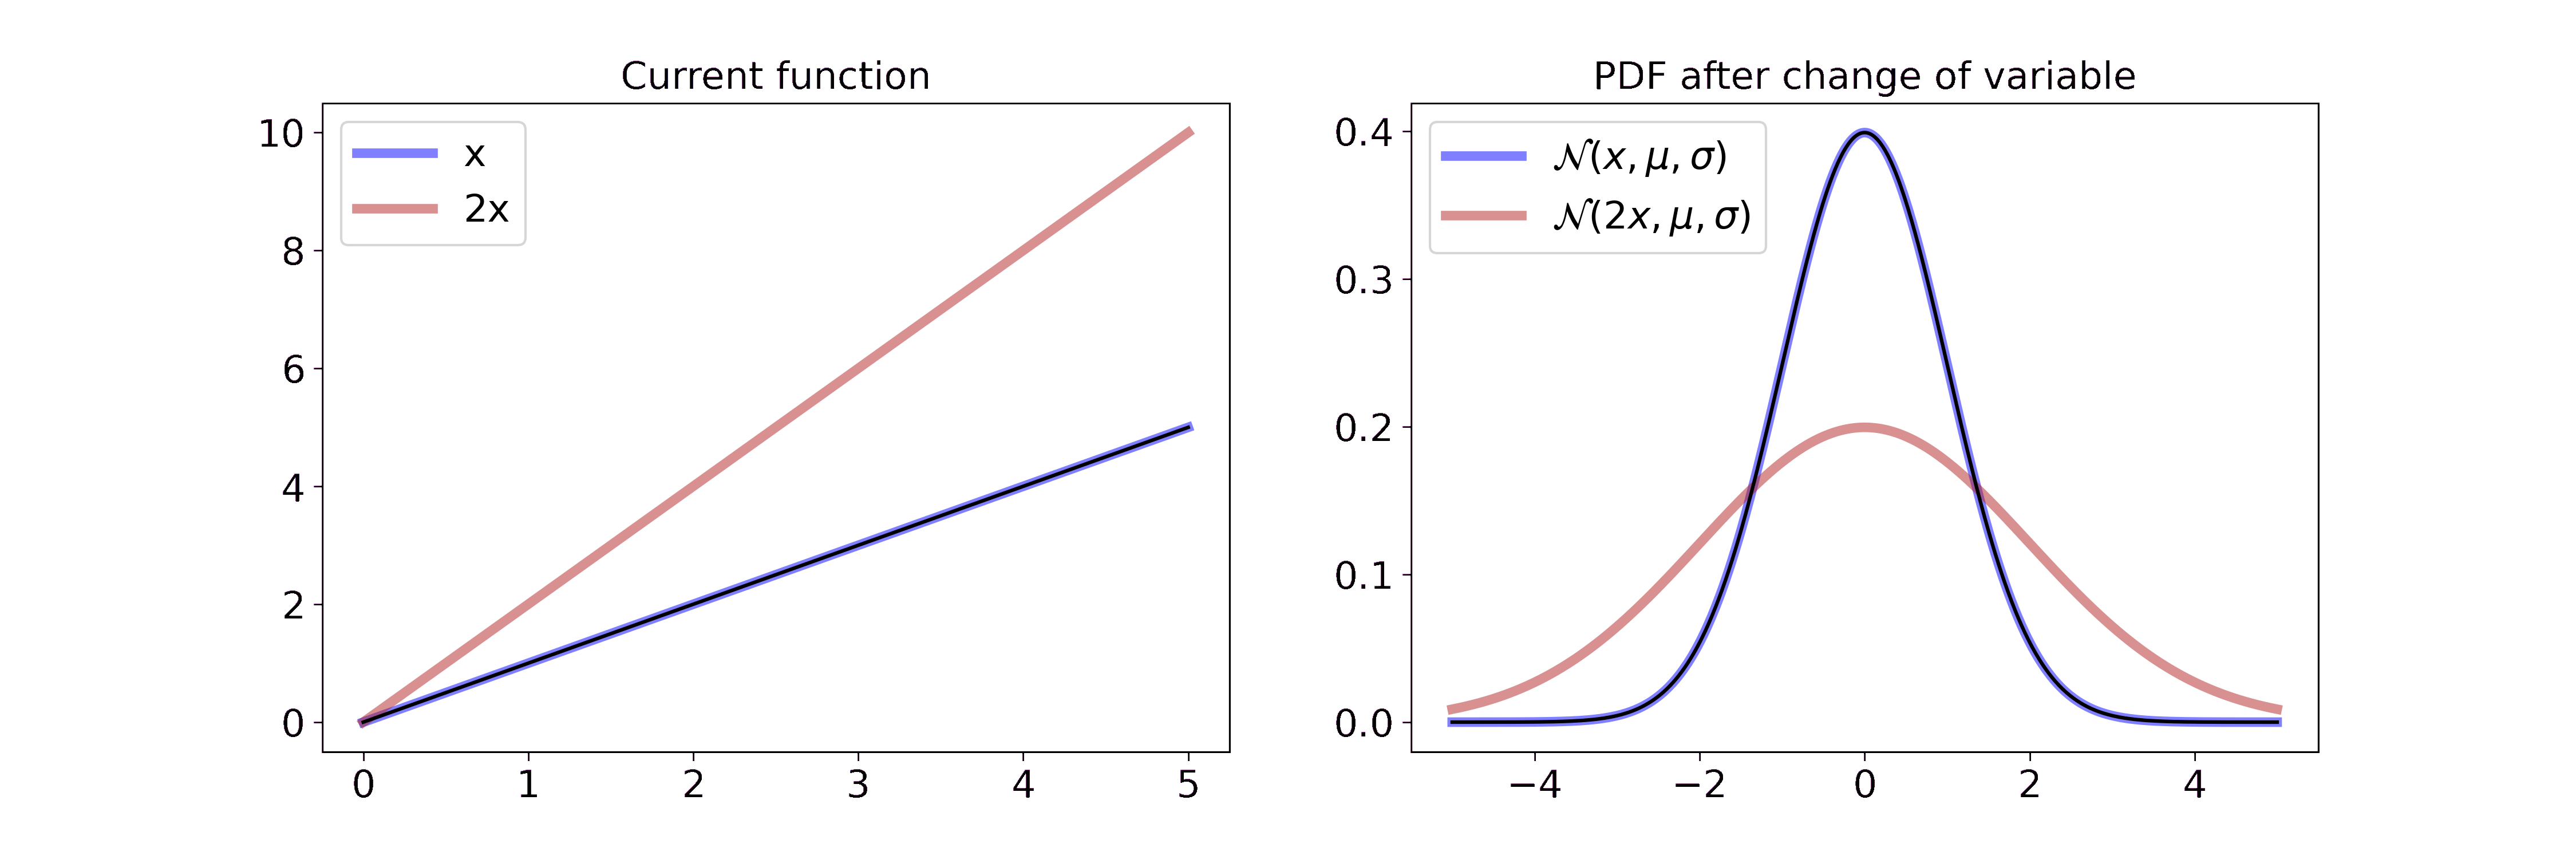
On the left we interpolate between the function \(x\) and \(2x\). On the right we interpolate between the resulting Gaussian pdf after a change of variable with the transformation from the left. Multiplying the random variable by \(2\) can be interpreted as stretching the underlying space of the random variable or pulling the wire from both sides. Since the pdf has to integrate to 1, the height of the pdf is reduced proportionally to the stretch. If you want to step through the GIF at your own pace you can find a HTML document in the GitHub repo.
Non-linear transformation: y = log(x)
Applying a non-linear transformation to our random variable, e.g \(y = \log(x)\), can be interpreted as a non-linear stretch or compression of the wire. In the case of the logarithm we map small values \((0 < x < 1)\) to larger negative numbers, i.e. we stretch the wire. Larger values \((x > 1)\) will be mapped to smaller numbers since \(\log(x) < x\) when \(x > 1\), i.e. we compress the wire.
For a Gamma random variable, the log transformation becomes
\[\begin{aligned} p_Y(y) &= f_X(g^{-1}(y)) \left\vert \frac{d}{dy}(g^{-1}(y)) \right\vert \\ &= \frac{\beta^{\alpha}}{\Gamma(\alpha)} g^{-1}(y)^{\alpha-1} \exp(-\beta g^{-1}(y)) \left\vert \frac{d}{dy}(g^{-1}(y)) \right\vert \\ &= \frac{\beta^{\alpha}}{\Gamma(\alpha)} \exp(y)^{\alpha-1} \exp(-\beta \exp(y)) \cdot \exp(y) \\ &= \frac{\beta^{\alpha}}{\Gamma(\alpha)} \exp(y)^{\alpha} \exp(-\beta \exp(y)) \end{aligned}\]which can be interpreted visually as
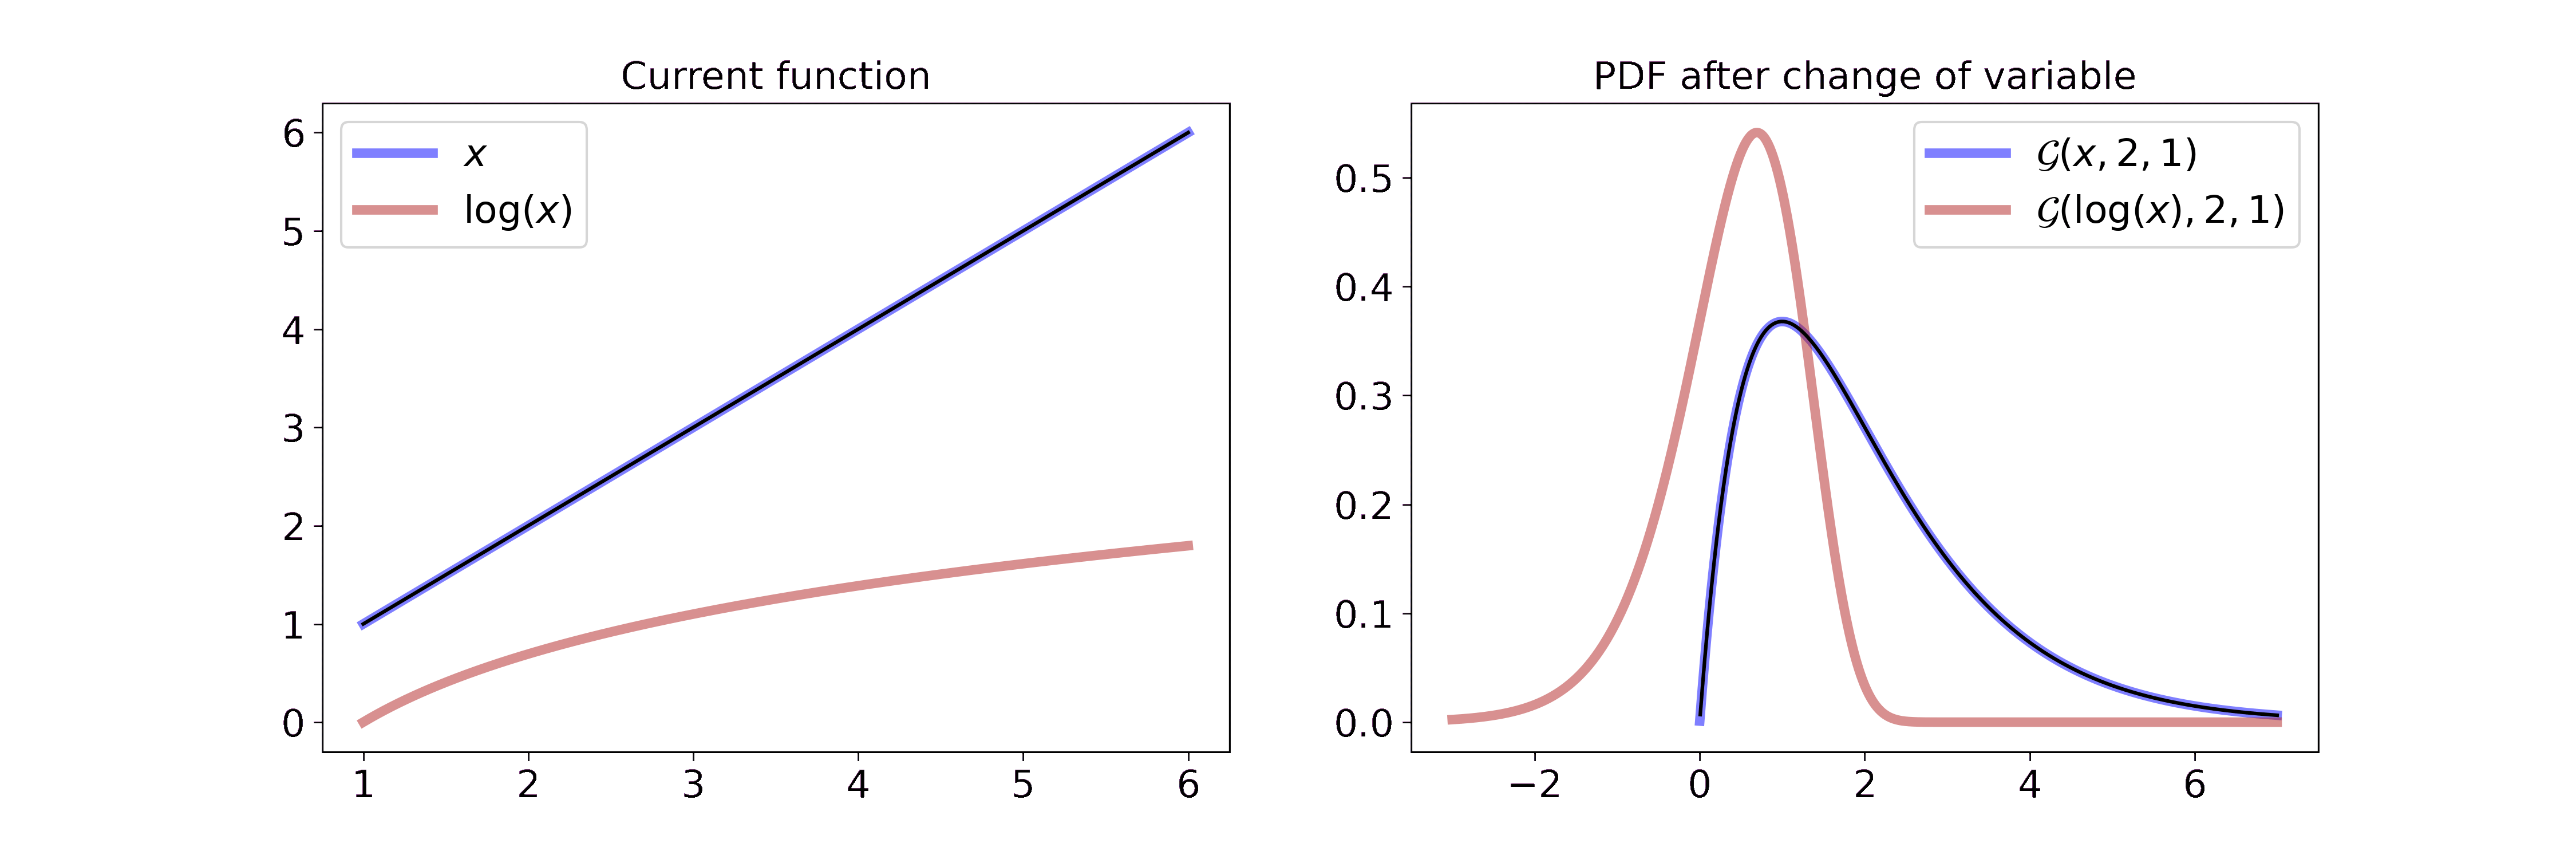
On the left we interpolate between the function \(x\) and \(\log(x)\). On the right we interpolate between the resulting Gaussian pdf after a change of variable with the transformation from the left. Due to the properties of the logarithm described above, it feels like the part left of the mode is stretched all the way to minus infinity and the part right of the mode is compressed. If you want to step through the GIF at your own pace you can find an HTML document in the GitHub repo.
The log-transformed Gamma distribution looks astonishingly close to a Gaussian. This simple observation gave rise to a new approximation scheme for generalized linear models that we developed during the first year of my Ph.D. If you are interested you can check out the associated blog post (link soon).
Non-monotonic transformations: y = sqrt(x)
Non-monotonic transformations such as the square root are not invertible in their entirety. Thus, we have to adapt the general change of variable equation by splitting the function into monotonic intervals.
\[f_Y(y) = \sum_{k=1}^{n(y)} f_X(g_k^{-1}(y)) \left\vert \frac{d}{dy}(g_k^{-1}(y)) \right\vert\]where \(n(y)\) is the number of invertible intervals and \(g_k^{-1}(y)\) is the inverse transformation on interval \(k\).
To illustrate this fact, consider the example of transforming a Chi-square random variable \(X\) with one degree of freedom (\(k=1\)) by the square root.
Let \(Y = \sqrt{X}\). Therefore, \(g(x) = \sqrt{x}\) and \(g_1^{-1}: \mathbb{R} \rightarrow (-\infty, 0)\) with \(g_1^{-1}(y) = -y^2\) and \(g_2^{-1}: \mathbb{R} \rightarrow [0, \infty)\) with \(g_2^{-1}(y) = y^2\). Then
\[\left\vert\frac{\partial g_i^{-1}(y)}{\partial y} \right\vert = \vert 2y \vert\]and
\[\begin{aligned} f_Y(y) &= f_y(h_1^{-1}(y)) \left\vert\frac{\partial h_1^{-1}(y)}{\partial y} \right\vert \mathbf{1}_r(y) + f_y(h_2^{-1}(y)) \left\vert\frac{\partial h_2^{-1}(y)}{\partial y} \right\vert \mathbf{1}_r(y) \\ &= \frac{1}{\sqrt{2\pi}} \frac{1}{2\sqrt{y^2}} \exp(-\frac{y^2}{2}) |2y| \mathbf{1}_{(-\infty, 0)}(y) + \frac{1}{\sqrt{2\pi}} \frac{1}{2\sqrt{y^2}} \exp(-\frac{y^2}{2}) |2y| \mathbf{1}_{[0, \infty)}(x) \\ &= \frac{1}{\sqrt{2\pi}} \exp(-\frac{y^2}{2}) \\ &= \mathcal{N}(y; \mu=0, \sigma^2=1) \end{aligned}\]Visually, this is
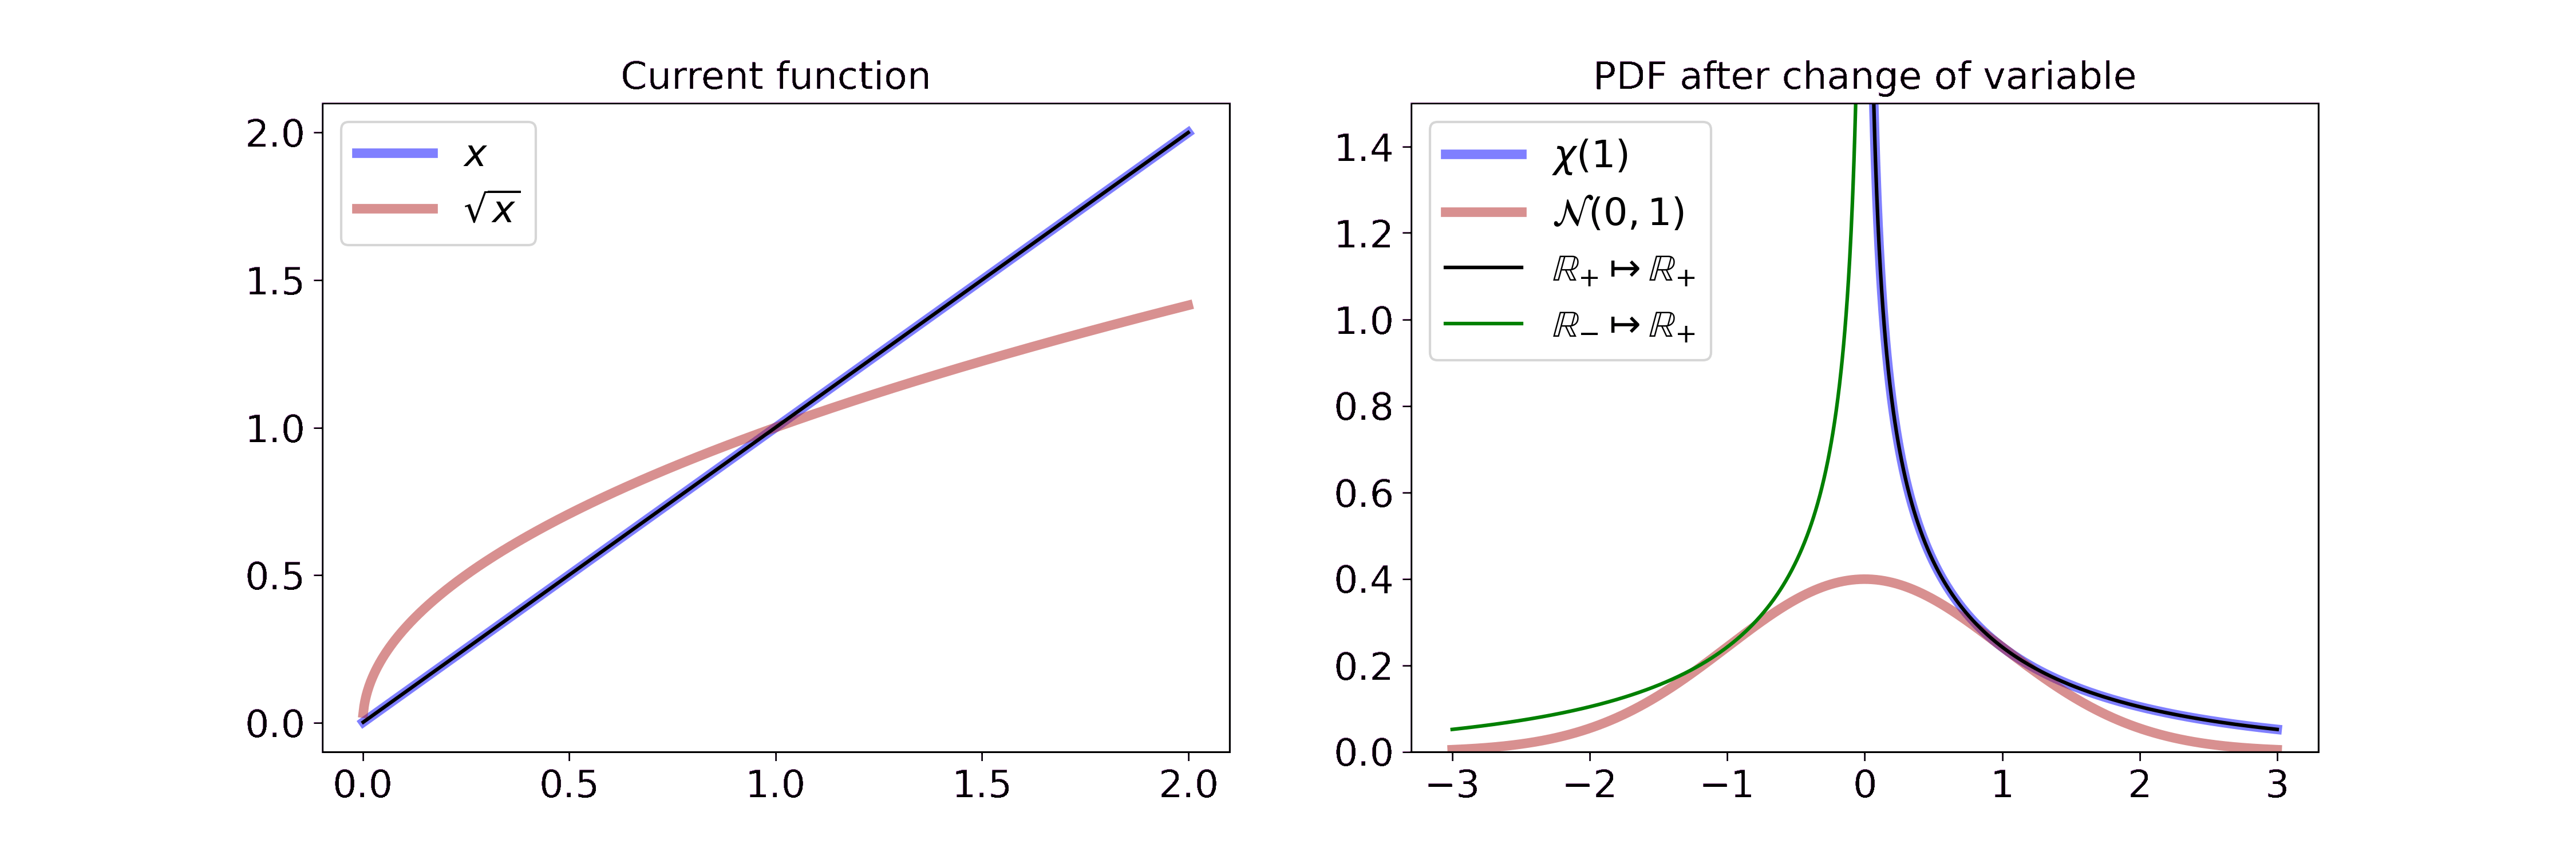
On the left, we interpolate between the function \(x\) and \(\sqrt{x}\). On the right, we split the real line at 0 and show the transformation for the positive and negative map. Combined together, the two derivations yield \(\mathcal{N}(y; \mu=0, \sigma^2=1)\) which is defined on the entirety of \(\mathbb{R}\). If you want to step through the GIF at your own pace you can find an HTML document in the GitHub repo.
With more dimensions, the split becomes more complicated. A positive definite matrix \(A\) has \(n\) distinct eigenvalues and \(2^n\) possible squareroots. \(A\) has a decomposition \(A=UDU^{-1}\) where \(U\)s columns are the eigenvectors of \(A\) and \(D\) is a diagonal matrix containing the eigenvalues \(\lambda_i\) of \(A\). Any square root of \(A\) is given by \(A^{\frac{1}{2}} = UD^{\frac{1}{2}}U^{-1}\). Since there are two possible choices for the square root of each eigenvalue \(+\sqrt{\lambda_i}\) and \(-\sqrt{\lambda_i}\) there are \(2^n\) possible choices for the matrix \(D^{\frac{1}{2}}\).
The Chi-square distribution is the one-dimensional version of the Wishart distribution and we split the transformation into \(2\) parts. For every additional dimension, we add \(2\) further possible splits due to the sign of the newly added eigenvalue. Thus, we have \(2^n\) splits for dimensionality \(n\). Deriving the matrix-square root transformation of the Wishart is out of the scope of this post, but it can be found in appendix B.7 of my paper.
Concatenating transformations
Assume we have two transformations \(g(x)\) and \(f(x)\). Then we can apply them sequentially, e.g. \(Y = g(X)\) and \(Z=f(Y)\), and can compute the resulting pdf either by applying the change of variable for \(f\) and then again for \(g\) or by transforming the concatenation \(f \circ g\). Naturally, we can do this with as many invertible functions as we like.
This is a powerful concept because it increases the expressiveness of possible transformations. In Machine Learning, normalizing flows make use of this concatenation by assuming that an unknown probability distribution, e.g. images, are a complicated transformation of a simple distribution such as a Gaussian. Normalizing flows then parameterize the transformation, e.g. by a neural network, and learn it from data. The result is a map from samples of a simple distribution to a complicated distribution, which can be used to generate new samples that are close but not similar to the training data.
One last note
If you want to get informed about new posts you can subscribe to my mailing list or follow me on Twitter.
If you have any feedback regarding anything (i.e. layout or opinions) please tell me in a constructive manner via your preferred means of communication.